Setting Up Grafana with Rackbank
Overview
Grafana is an open-source platform designed for monitoring and observability. It helps users query, visualize, and understand their metrics, regardless of where they are stored. With Grafana, you can create dynamic dashboards, set up alerts, and integrate with various data sources to gain comprehensive insights into complex systems.
Key Features of Grafana
1. Visualizations
- Customizable dashboards with a wide range of charting options.
- Powerful graphs, tables, heatmaps, and more for data visualization.
- Advanced panel features to tailor dashboards to your needs.
2. Data Source Integration
- Supports integration with a wide variety of data sources like:
- Prometheus
- Elasticsearch
- Graphite
- InfluxDB, and more.
- Easily query and visualize data from different systems in one unified dashboard.
3. Alerting
- Configurable alerting rules to notify you of potential issues.
- Multiple notification channels including email, Slack, and others.
- Set thresholds to trigger alerts based on the collected metrics.
4. Annotations
- Add markers on graphs to indicate key events or important points in time.
- Useful for tracking incidents, releases, or other significant changes.
5. Plugins
- Extend Grafana's functionality with plugins, both community-created and custom-built.
- Examples include additional data sources, panel types, and app integrations.
6. Integrating Grafana with Prometheus
Grafana and Prometheus work seamlessly together to monitor and visualize time-series data. Prometheus collects and stores the metrics, while Grafana visualizes that data through powerful dashboards.
Steps to Set Up Grafana with Prometheus:
1. Install Prometheus
- Set up Prometheus to start collecting time-series data from your applications or infrastructure.
2. Install Grafana
- Download and install Grafana on your system. Follow the official Grafana installation guide for detailed instructions.
3. Configure Prometheus Data Source
- In the Grafana UI, go to "Configuration" -> "Data Sources" and select "Prometheus" as the data source.
4. Enter Prometheus URL
- Provide the URL of your Prometheus instance (e.g., http://localhost:9090), and click "Save & Test" to verify the connection.
5. Create Dashboards
- Create new dashboards or import pre-built dashboards to start visualizing your metrics collected by Prometheus.
6. Set Up Alerts
- Configure alerting rules in Grafana to notify you about important events or anomalies in your metrics.
Rackbank Integration
Rackbank provides a robust platform for infrastructure and hosting services, making it ideal for integrating with Grafana. By using Rackbank's services to host Prometheus or Grafana, you can enhance your monitoring and observability setup.
- Scaling: Leverage Rackbank's infrastructure to scale your monitoring systems as needed.
- Reliability: Rackbank offers reliable, high-availability hosting to ensure your monitoring stack is always up and running.
- Performance: Enjoy enhanced performance for large-scale data collection and visualization.
Conclusion
Grafana and Prometheus, when combined with Rackbank’s reliable infrastructure, provide a powerful solution for monitoring and visualizing the performance of your systems. The flexibility and extensibility of Grafana, along with the robust metrics collection of Prometheus, enable teams to stay on top of their infrastructure health and quickly identify any potential issues.
Installing Grafana and Prometheus on Ubuntu 22.04
This guide will show you how to install Grafana and Prometheus on an Ubuntu 22.04 system, enabling you to monitor and visualize metrics effectively. Follow the step-by-step instructions below to set up your monitoring platform.
Prerequisites
- Operating System: Ubuntu 22.04
- Prometheus Version: 2.31.2
- Grafana Version: 11.0
Step 1: Update and Upgrade the System
Before installing any software, it’s essential to ensure your system is up to date. Open a terminal and run the following commands:
sudo apt-get update -y
sudo apt-get upgrade -y
Step 2: Install Grafana
Now, let's install Grafana. To get started, we need to add the Grafana repository to the system.
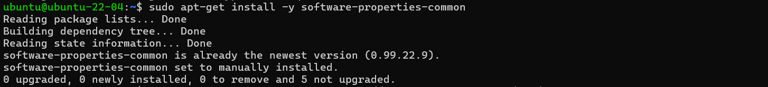
- Install necessary dependencies:
sudo apt-get install -y software-properties-common
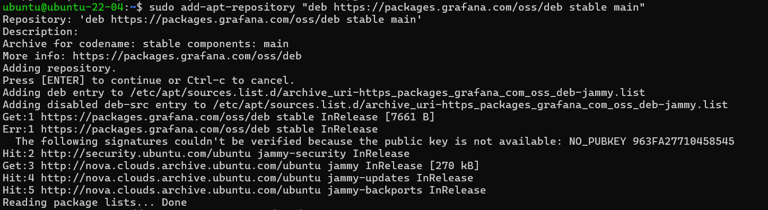
- Add the Grafana repository:
sudo add-apt-repository "deb https://packages.grafana.com/oss/deb stable main"
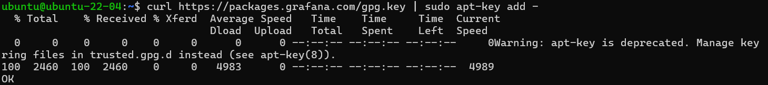
- Add the Grafana GPG key:
curl https://packages.grafana.com/gpg.key | sudo apt-key add -
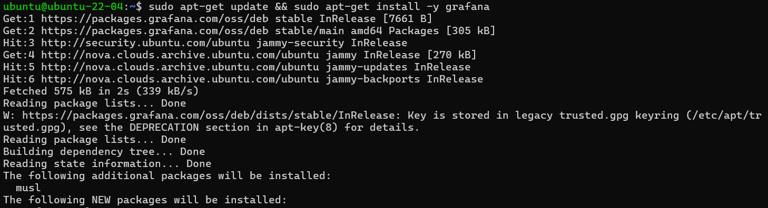
- Update the system package list and install Grafana:
sudo apt-get update && sudo apt-get install -y grafana
- Start and enable the Grafana service:
sudo systemctl start grafana-server
sudo systemctl enable grafana-server
Grafana should now be up and running on your system.
Step 3: Install Prometheus
Next, let’s install Prometheus, a powerful tool for monitoring and alerting.
- Install Prometheus using the following command:
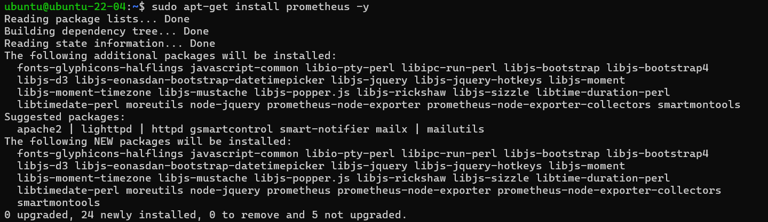
sudo apt-get install prometheus -y
- Start and enable the Prometheus service:
sudo systemctl start prometheus
sudo systemctl enable prometheus
Step 4: Verify Grafana and Prometheus Versions
You can check the installed versions of Grafana and Prometheus to ensure that everything is set up correctly.
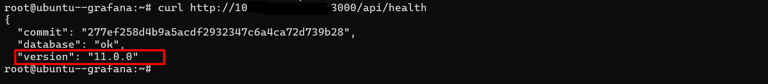
- Check Grafana Version:
Run the following command, replacingyour_server_ipwith your server’s IP address:
curl http://your_server_ip:3000/api/health
- Check Prometheus Version:
Run this command to check Prometheus’ version:
prometheus --version

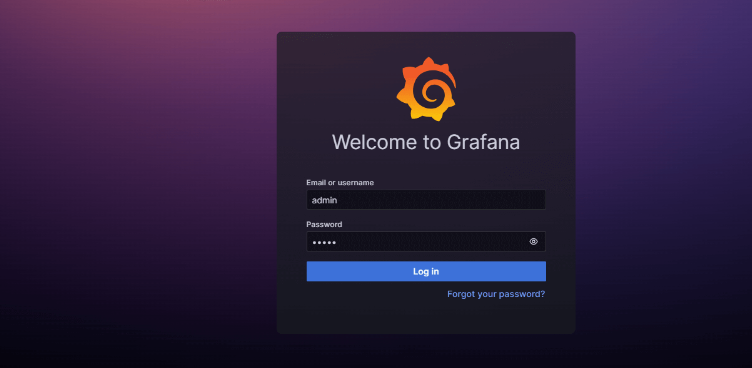
Step 5: Access Grafana in Your Browser
You can access the Grafana dashboard by opening a web browser and navigating to:
http://<Your_Server_IP>:3000
The default login credentials are:
- Username: admin
- Password: admin
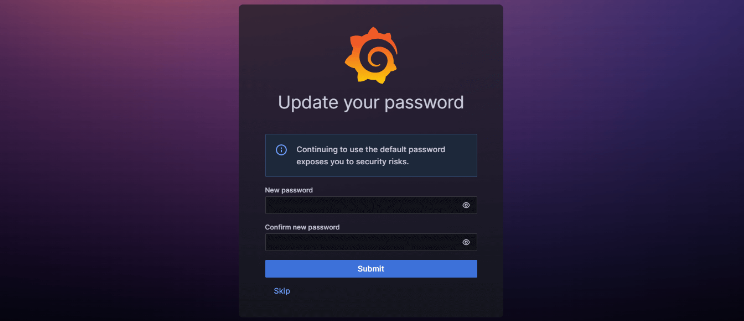
You will be prompted to change the default password to something more secure.
Step 6: Integrating Prometheus with Grafana
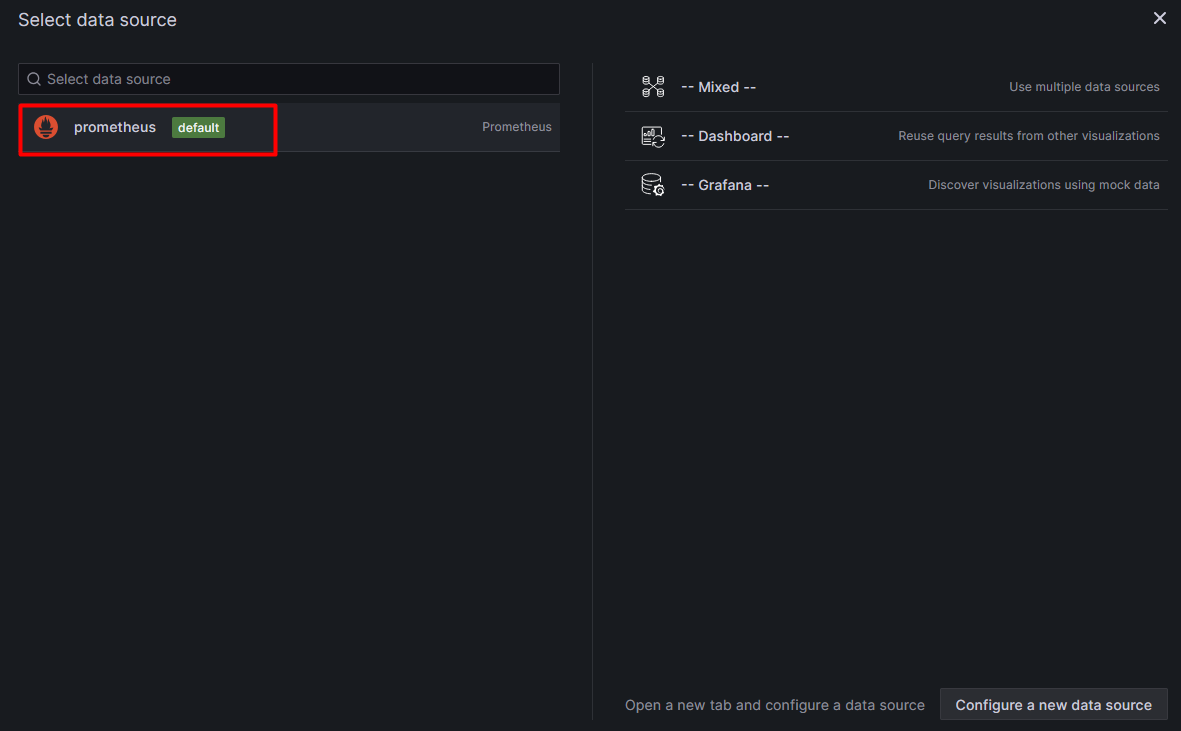
To visualize your metrics in Grafana, you’ll need to configure Prometheus as a data source. Add Prometheus as a data source:
- Click the Grafana logo in the top-left corner to open the main menu.
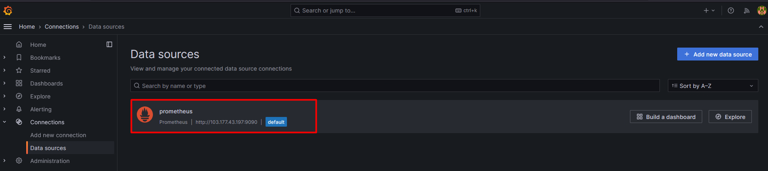
- Select Data Sources and click Add Data Source.
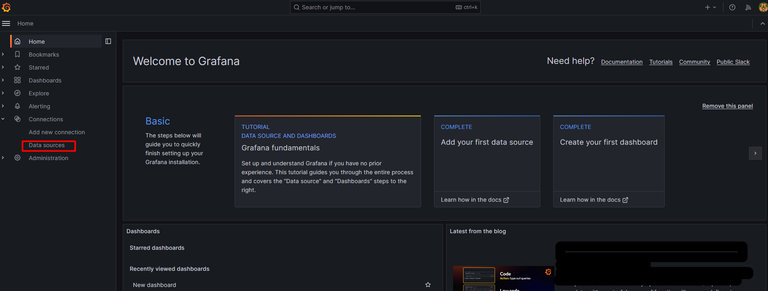
- Choose Prometheus as the data source type.
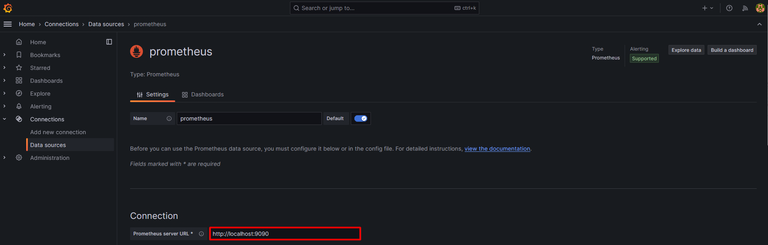
- Set the URL to
http://localhost:9090(or use the IP address if Prometheus is running on a different server). - Save and Test the connection:
After entering the URL, click Save & Test to verify the connection.
Step 7: Create a Dashboard in Grafana
Once Prometheus is added as a data source, you can create a dashboard to visualize your metrics.
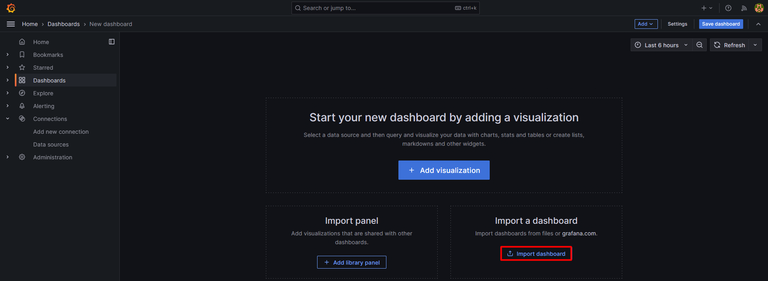
- Create a new dashboard:
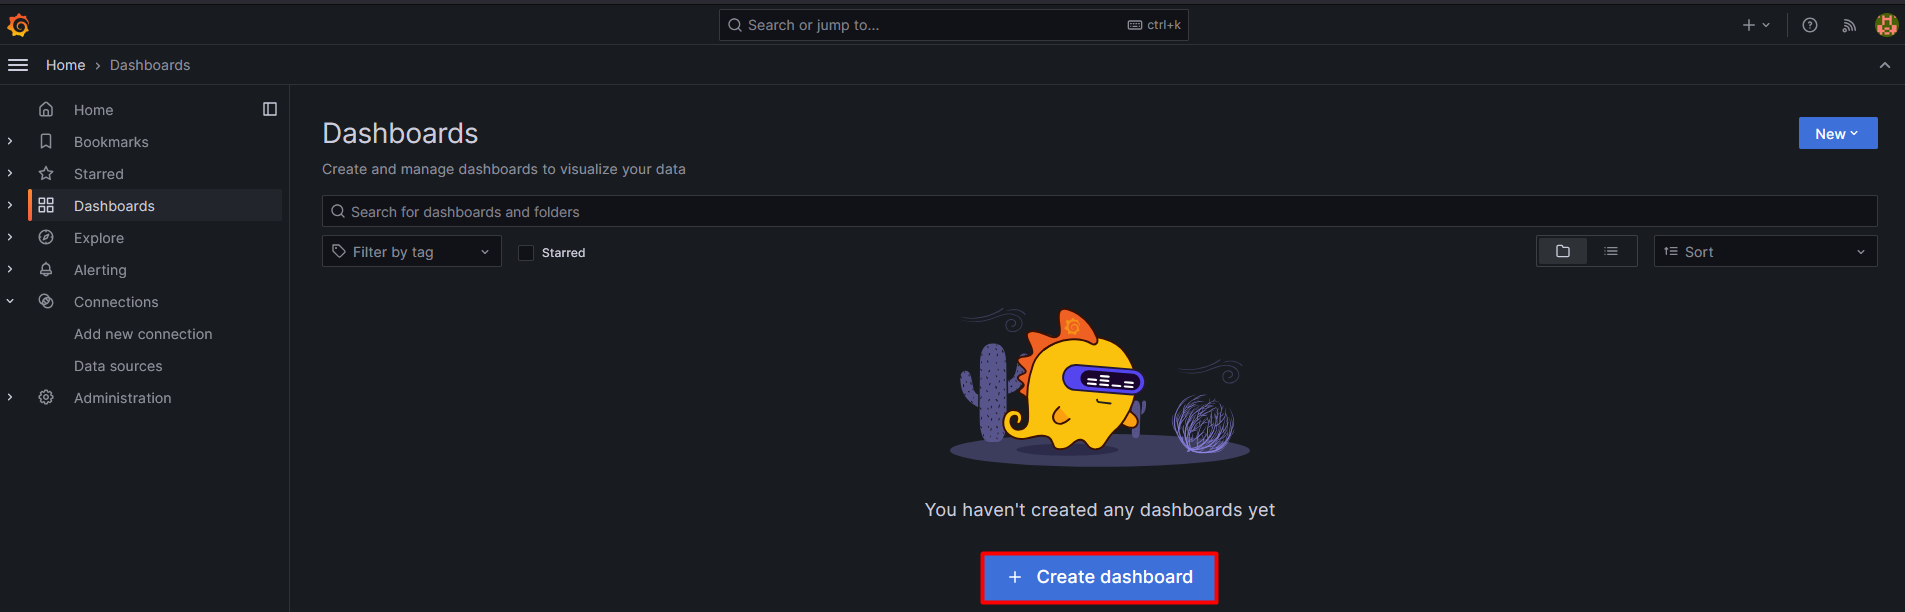 Click on the + icon in the left menu and select Import Dashboard.
 - Import a pre-built dashboard:
 You can import a ready-made dashboard from Grafana’s community or create a custom one.
 - Configure the dashboard:
Select the appropriate visualization type (e.g., graphs, tables) for your metrics.
Add queries to display your data using PromQL (Prometheus Query Language).
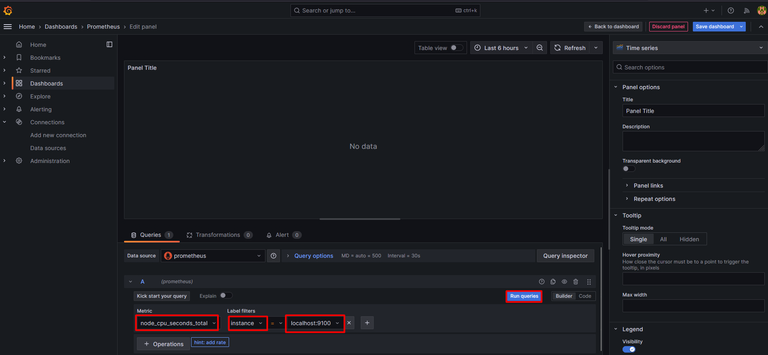
Step 8: Customize the Dashboard
 After creating your dashboard, you can further customize it:
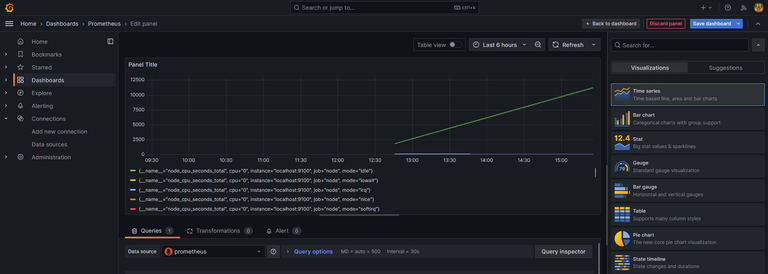
- Select a matrix or other visualization types.
- Define labels and select the values to display.
- Run queries to retrieve data from Prometheus and visualize the results.
 You can adjust the visualizations, time ranges, and queries as needed to meet your monitoring needs.
Key Features of Prometheus
- Multi-dimensional Data Model: Metrics are identified by labels, allowing you to group and query data in various ways.
- PromQL (Prometheus Query Language): A powerful query language that enables complex data analysis and extraction.
- Pull-based Collection: Prometheus scrapes data from HTTP endpoints at regular intervals to collect metrics.
- Alerting: Prometheus integrates with alert managers to send notifications based on defined alert rules.
- Kubernetes Compatibility: Prometheus works seamlessly in containerized environments, especially with orchestration platforms like Kubernetes.